LAB ITSI content_pack
Task 1: Login to your Splunk Instance
We deeply believe that the best way for you to familiarize yourself with the Splunk IT Service Intelligence (ITSI) Add-On is to get your hands dirty. Therefore, we provided individual sandbox environments in the form of Splunk instances for you. The first task of this workshop for you is to connect to those instances.
A successful connection to your instance can be established via executing the following steps:
// Caution: Screenshot and actual Google spreadsheet are just placeholders for now (this webpage is under construction), and don't do anything!
1. Access the Instance List by clicking HERE.
You should be able to see a Google spreadsheet that looks similar to the screenshotted example below:
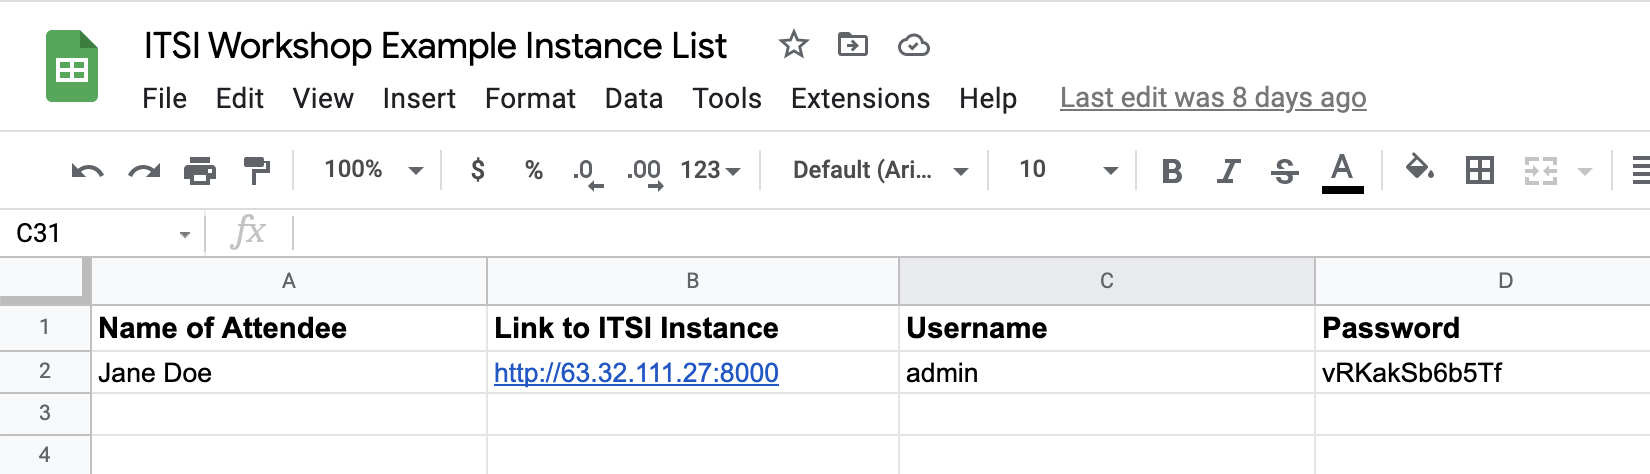
2. In the first column with the title Name of Attendee locate your name. Find your personal access link to the instance on the right of your name and use it to reach the login page of Splunk Enterprise. It looks like this:
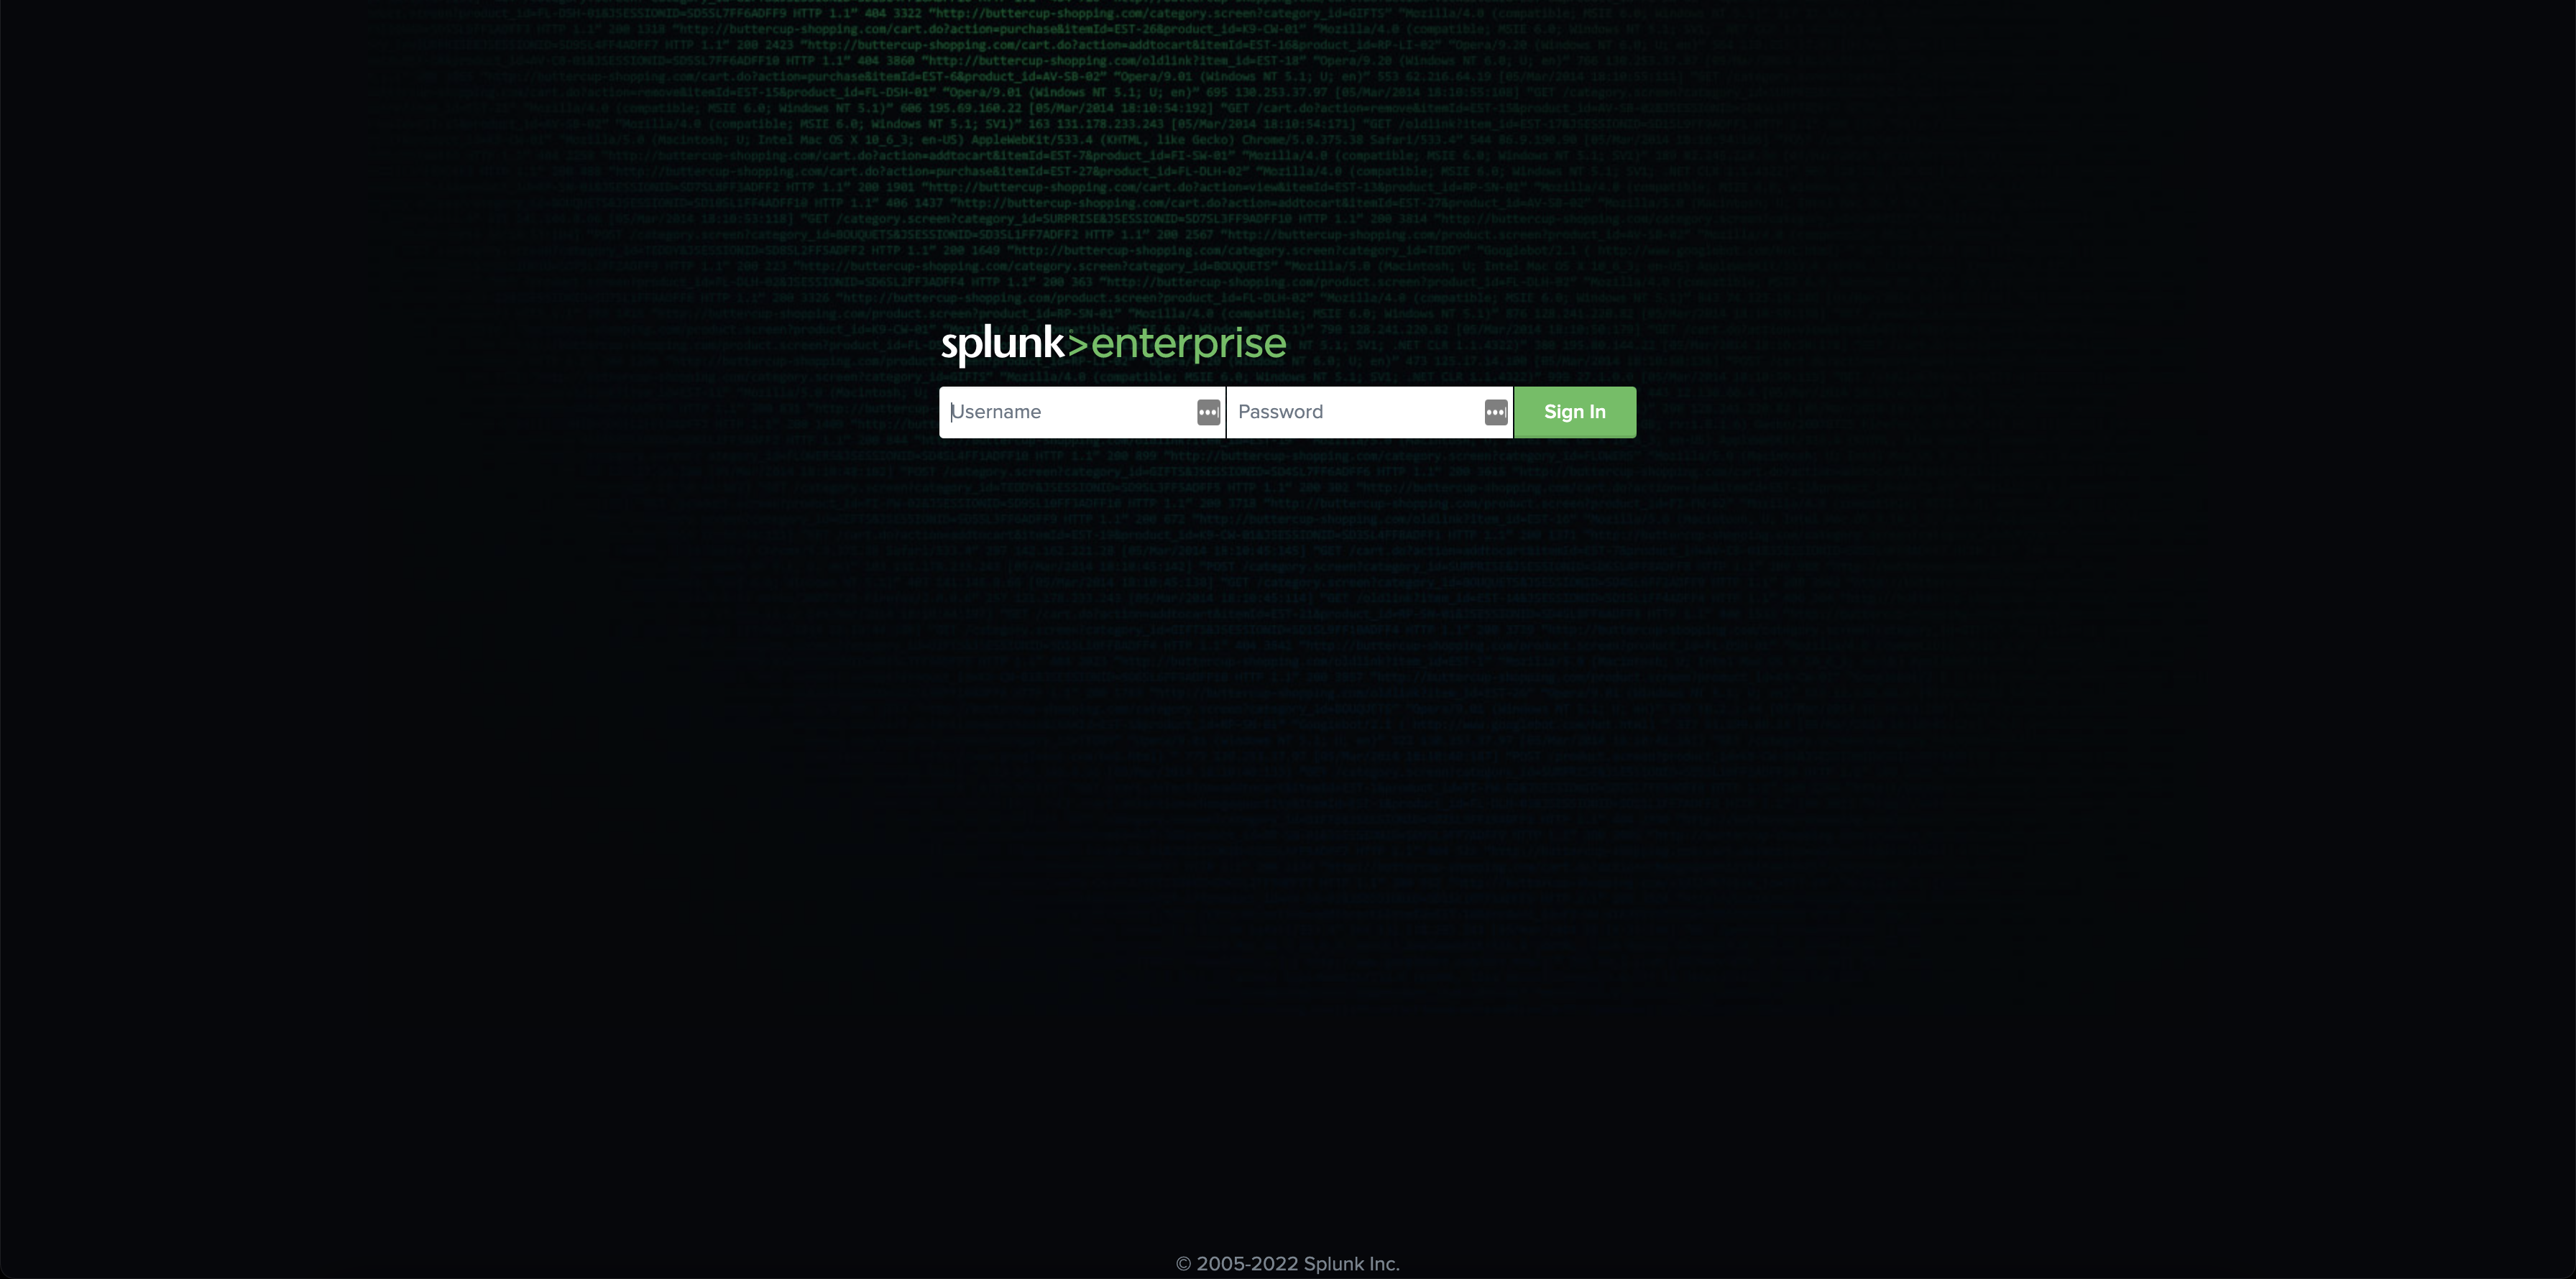
3. To log in, use the username admin. Use the password is provided for you in the Instance List. Click the Sign In-Button.
4. On a successful login, you might get greeted by pop-up windows showing tips, tutorials, and/or recommendations. These are not important for us right now. Feel free to ignore them by clicking the Got it!-Button, or respectively, the Don't show me this again-Button. Other than that, you should be able now to see Splunk Enterprise Home view, which initially looks like this:
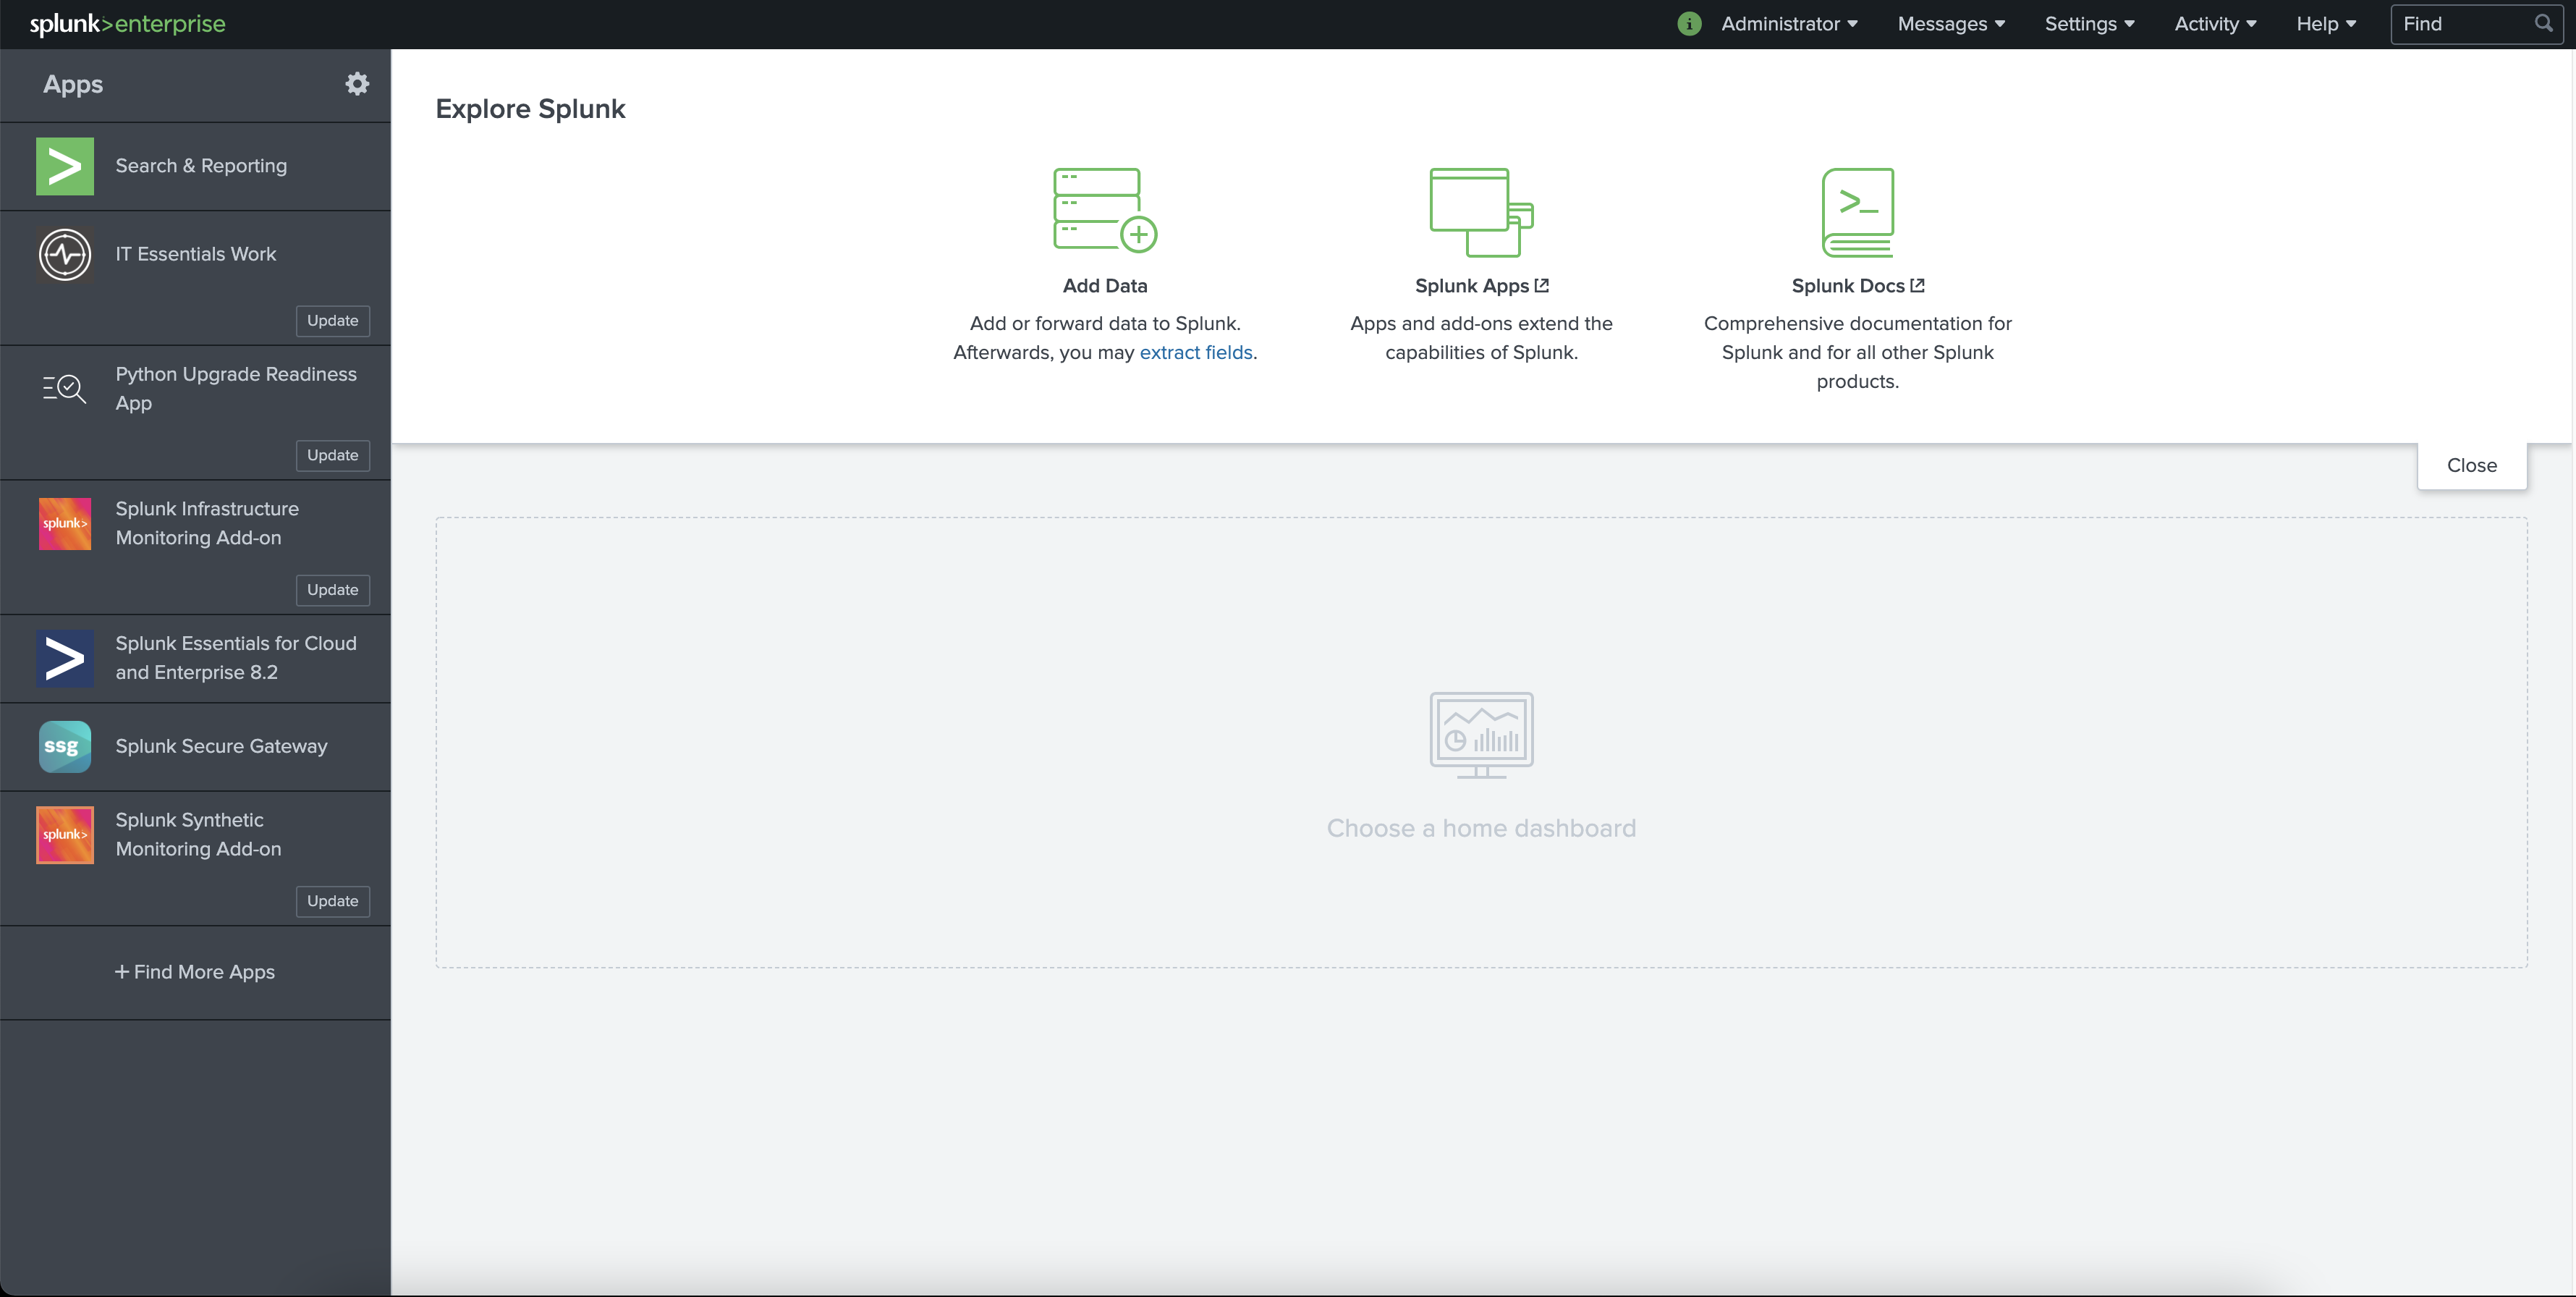
If you fail to see this home view, most likely something went wrong. Please do not hesitate to raise your hand in Zoom, or shoot us a short message in the Zoom channel. An assistent will be with you shortly.
If that is not the case, we want to congratulate you! You successfully connected to your instance, and thus completed the first task!
Task 2: Configure the Infrastructure Add-on and the Observability Content Pack
Now that we have access to our instances, which bear the pre-installed Infrastructure Monitoring Add-On and the Observability Content Pack, we need to configure those two by follwoing the steps below.
Task 2.1: Configuration of the Infrastructure Monitoring Add-on
-
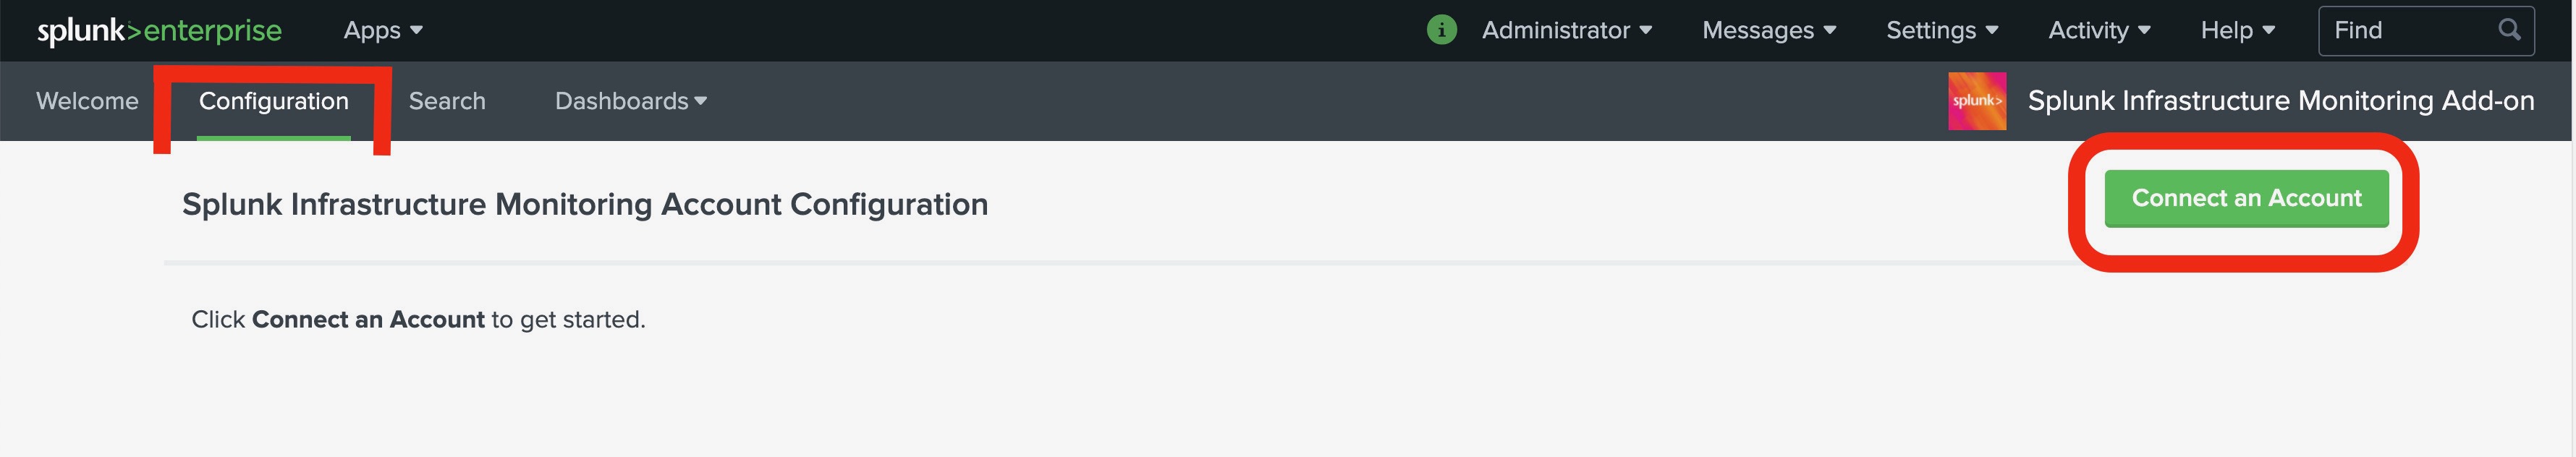
After you accessed your instance, navigate to the Splunk Infrastructure Monitoring Add-On listed on the left under Apps. We want to set up an account, and we can do so by navigating to the Configuration Tab and clicking on the 'Connect an Account'-Button.
Once you clicked the 'Connect an Account'-Button, a dialogue appears, prompting you for the user credentials of your Observability Cloud account. These are the Access Token and the Realm, with which the Add-On can access the Oberservability Cloud. In the next steps, we are going to locate our Realm inside our individual Observability Cloud account and create a new Access Token. -
Locate your Realm: Log in to your Splunk Observability account. In the menu on the left on the bottom click on the little
 icon (
 respectively if the menu is expanded). On the very top of this menu, you should see your username right next to a profile picture. Click on it. You are now in the Account Settings, where you can find the Realm (see screenshot below).
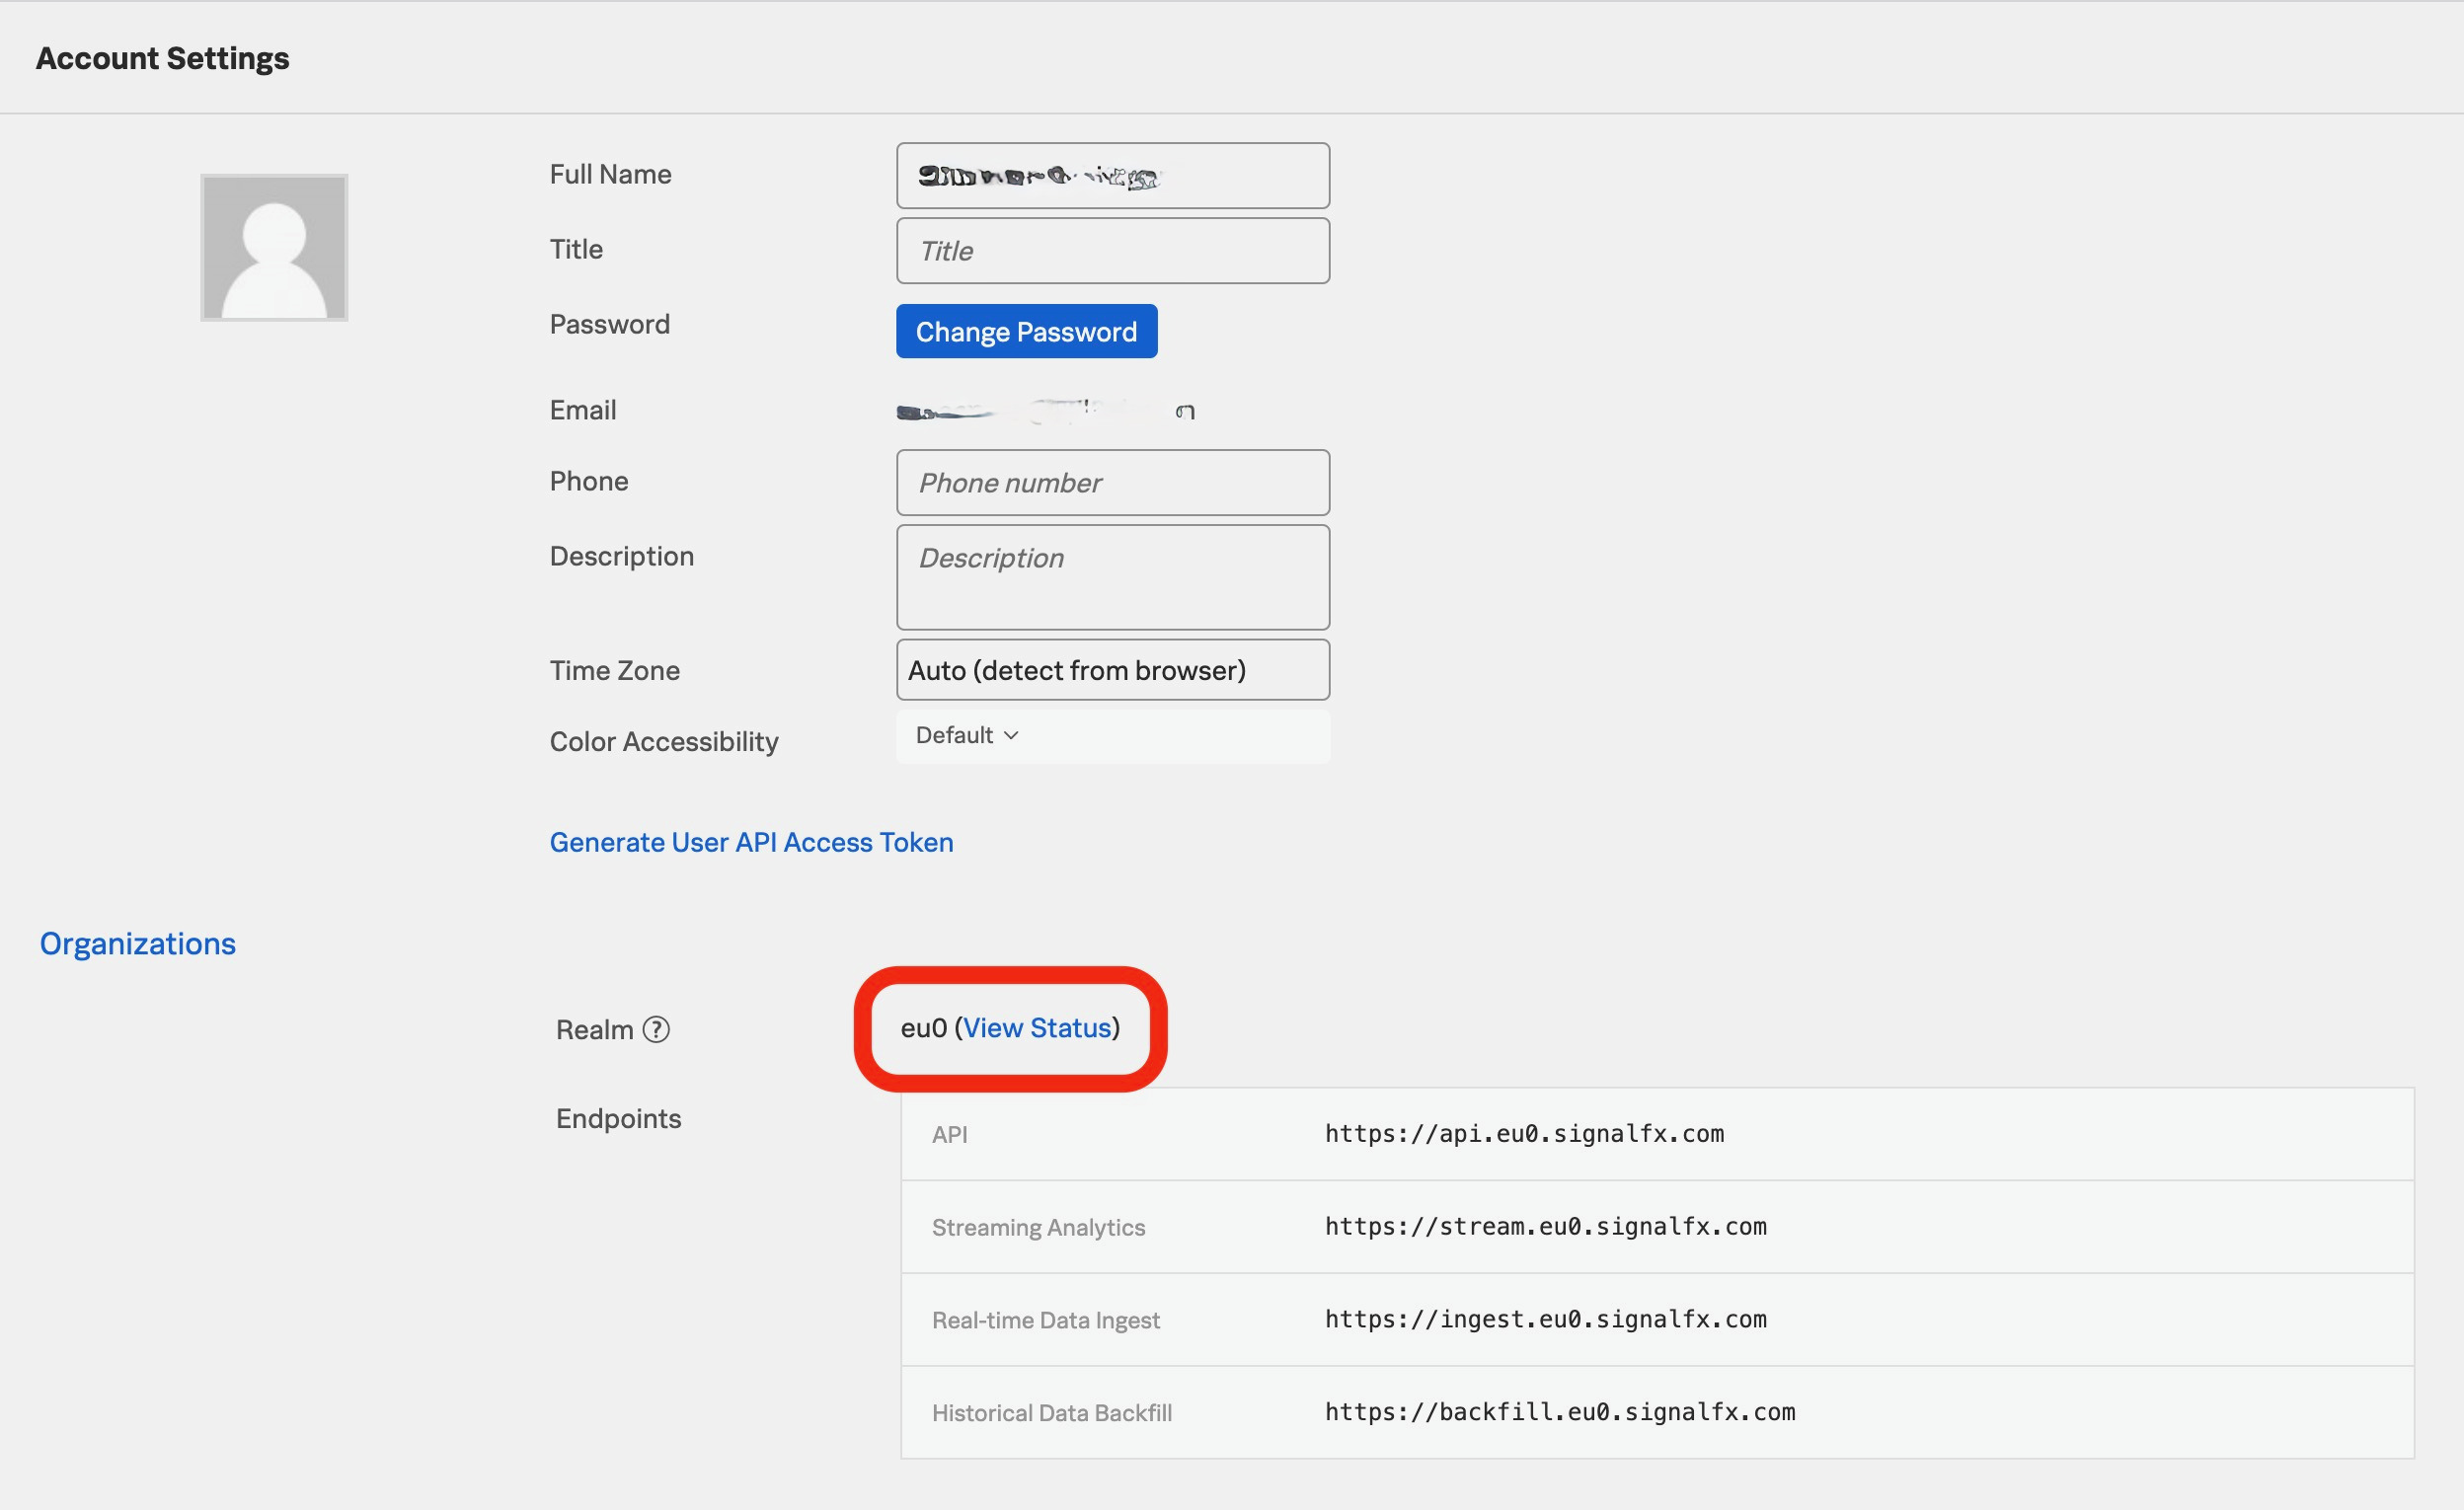
Copy and paste the Realm into the input field of of the dialogue in the IM Add-On. -
Locate your Access Token: Being still in your Account Settings, click on
 to generate an access token, and subsequently on
  to show the associated string. Copy and paste that string into the input field of of the dialogue in the IM Add-On.
 -
Once the Realm and Access Token have been inserted into the input dialogue, make sure to verify whether or not a connection to the Observability Cloud could be established by clicking on the Check Connection-button. If so, click submit. You can enable data collection for the account by selecting the Data Collection toggle.
For additional information on this topic, see Configure the Splunk Infrastructure Monitoring Add-on.
*Watch this video introducing the content pack concepts.
Task 2.2: Configure the Content Pack for Observability
-
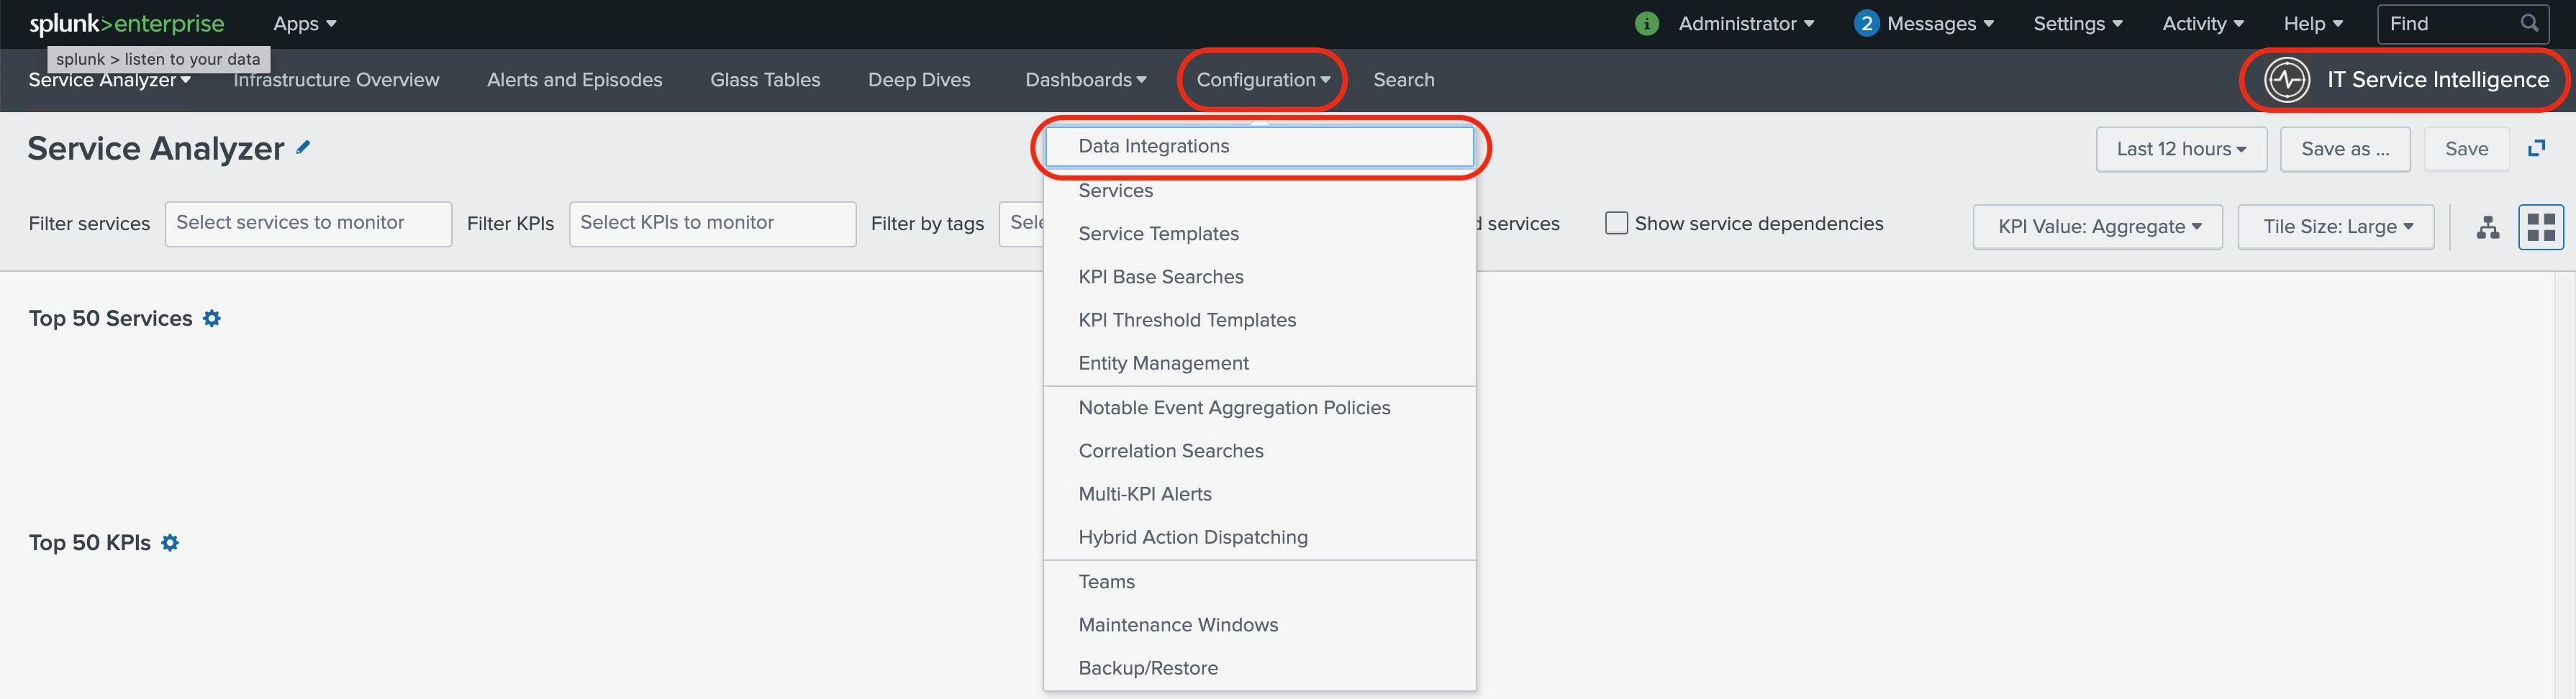
As soon as we have successfully configured the Infrastructure Monitoring Add-On, we will continue by installing and configuring the Content Pack for Observability. The first step to accomplish that is to select the IT Service Intelligence app. Inside the app, click on the Configuration tab and select Data Integrations from the dopdown menu.
-
On the next screen, select Add content packs and choose Splunk Observability Cloud.

-
Upon clicking on the Splunk Observability Cloud-tile, you are presented with an overview of what is included in the Content Pack. Review it, and finally click on
 .
. -
Next, you are presented with a settings menu to configure the content pack. The following is important:
Please disable the Import as enable-option, leave the Enter a prefix input field blank, and disable the Backfill service KPIs option.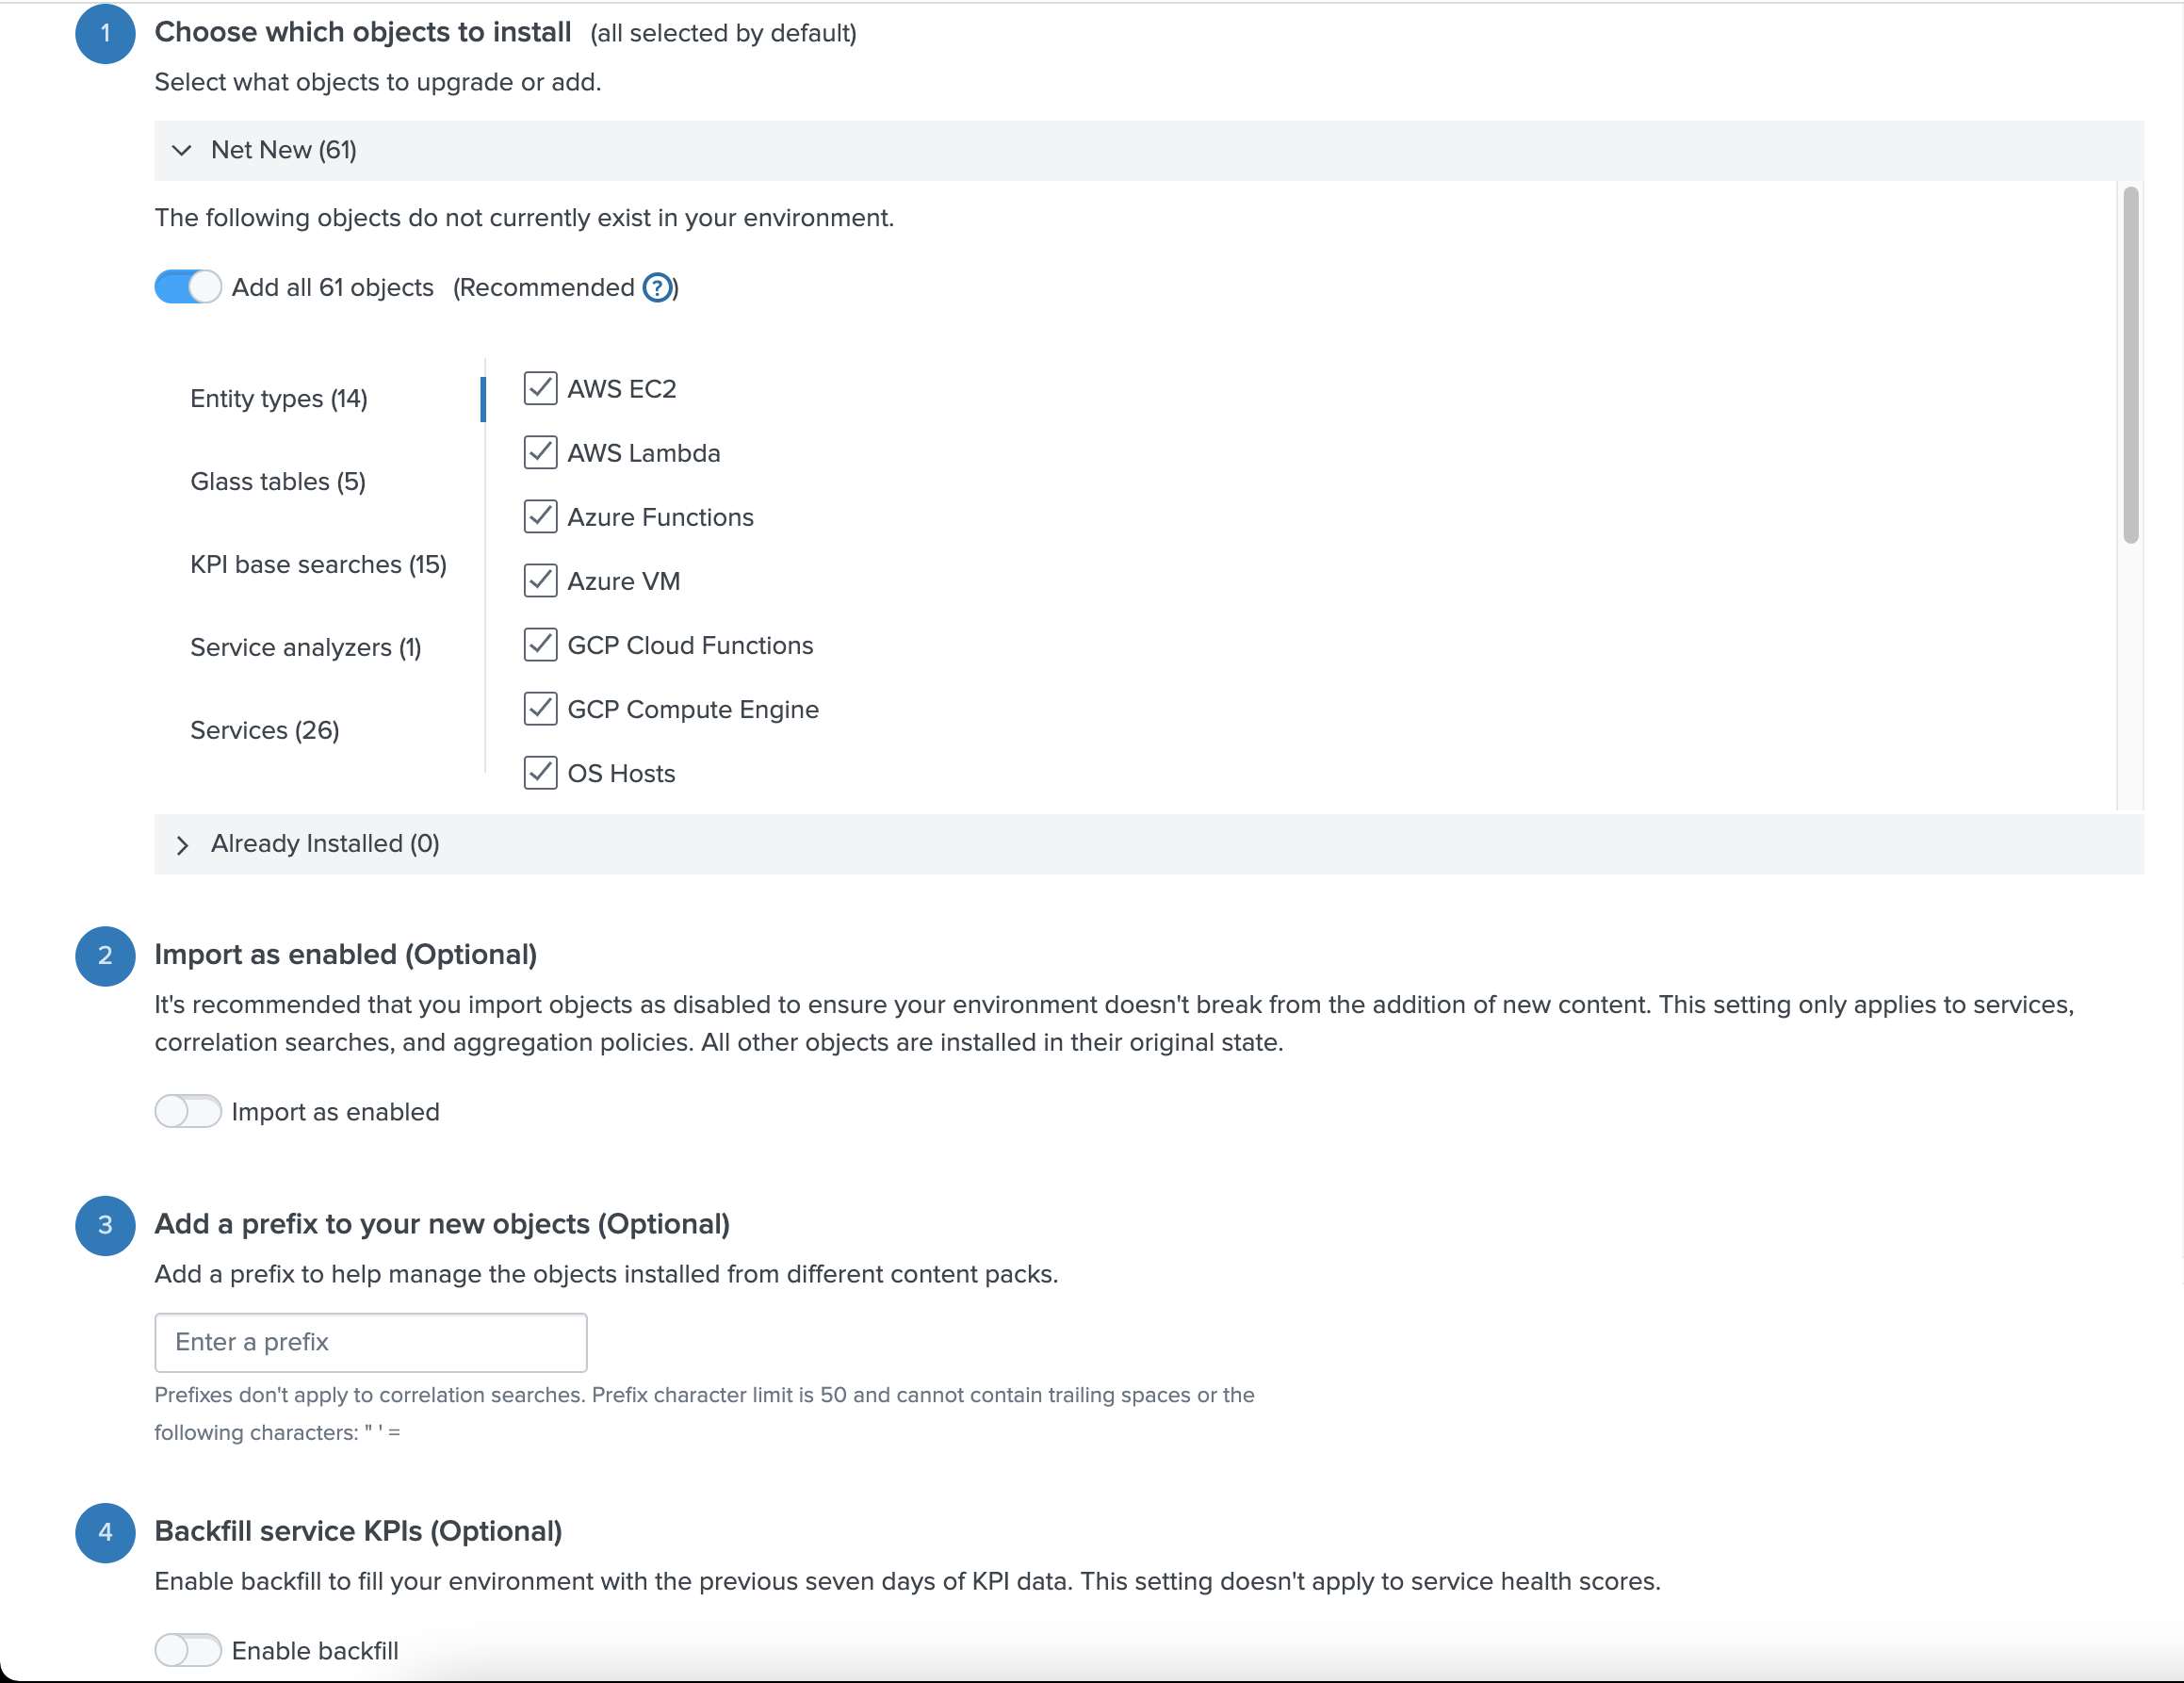
Finally, click on the [Install selected] button. -
The Splunk Observability Cloud tile on the Data Integrations page should now have a little green checkmark on the upper right corner. This means that we are all set. Perfect!
For additional information on this topic, see Install the Content Pack for Splunk Observability Cloud.
Task 3: Create a custom service
Open the EBS Dashboard -> open Total Ops/Reporting Interval -> view signalflow
You hould see the following :
A = data('VolumeReadOps', filter=filter('namespace', 'AWS/EBS') and filter('stat', 'sum'), rollup='rate', extrapolation='zero').scale(60).sum().publish(label='A')
B = data('VolumeWriteOps', filter=filter('namespace', 'AWS/EBS') and filter('stat', 'sum'), rollup='rate', extrapolation='zero').scale(60).sum().publish(label='B')
data('VolumeReadOps', filter=filter('namespace', 'AWS/EBS') and filter('stat', 'sum'), rollup='rate', extrapolation='zero').scale(60).sum().publish(label='A');
data('VolumeWriteOps', filter=filter('namespace', 'AWS/EBS') and filter('stat', 'sum'), rollup='rate', extrapolation='zero').scale(60).sum().publish(label='B')
run the following command:
| sim flow query=data('VolumeReadOps', filter=filter('namespace', 'AWS/EBS') and filter('stat', 'sum'), rollup='rate', extrapolation='zero').scale(60).sum().publish(label='A');
data('VolumeWriteOps', filter=filter('namespace', 'AWS/EBS') and filter('stat', 'sum'), rollup='rate', extrapolation='zero').scale(60).sum().publish(label='B')
| timechart max(VolumeReadOps) max(VolumeWriteOps)
Task 3.1: Let's create our EBS service
Make sure to go into Splunk IT Service Intelligence.
Configuration -> Service -> Create services -> Create service
Enter Title: EBS volumes
Select Manually add service content
(screenshot to be added)
KPI -> new -> Generic KPI
Click Next
Paste the command we just created in the textbox
| sim flow query="data('VolumeReadOps', filter=filter('namespace', 'AWS/EBS') and filter('stat', 'sum'), rollup='rate', extrapolation='zero').publish()"
| rename _value as VolumeReadOps
In the treshold field enter VolumeReadOps (you can keep everything default for the rest of the configuration)
click next
click next
click next
add threshold manually (if nothing is happening on the Disk it might show close to 0 as a number)
save on the bottom of the page !!!
Let's attach our standalone to the AWS service
go to Service open AWS service
go to Service Dependencies tab
Add Dependencies
Use the filter to select EBS volumes
Select the service health score
go to Service Analyzer -> Default Analyzer
review what you built
Task 4: Get to know Entity types
Task 4.1: Splunk APM Entity type
tbc
Task 4.2: Enable Modular Input for APM error rate and APM thruput
Task 4.3: Enable the Splunk APM Services
Enable APM Service (4 service to enable)
- Application Duration
- Application Error Rate
- Application Performance Monitoring
- Application Rate (Throughput)
Task 4.4: Enable Cloud Entity Search for APM
Go to Settings -> Searches, Reports, and Alerts
Select App Splunk Observability Cloud | Owner All
Find the line ITSI Import Objects - Splunk-APM Application Entity Search -> (Actions) Edit -> Enable
NOTE those searches are called Cloud Entity Searches
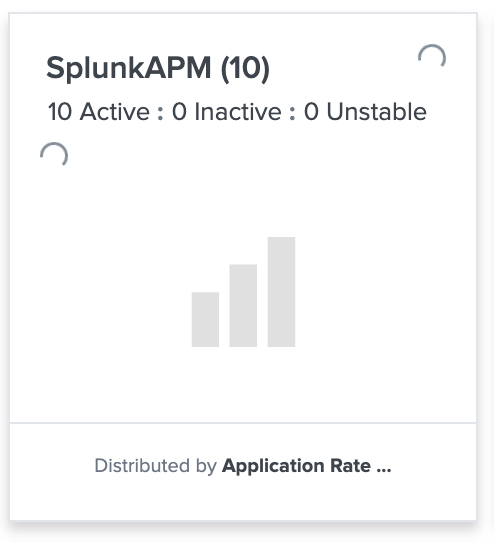
Open ITSI -> Infrastructure Overview
Verify that you have your entities are showing up
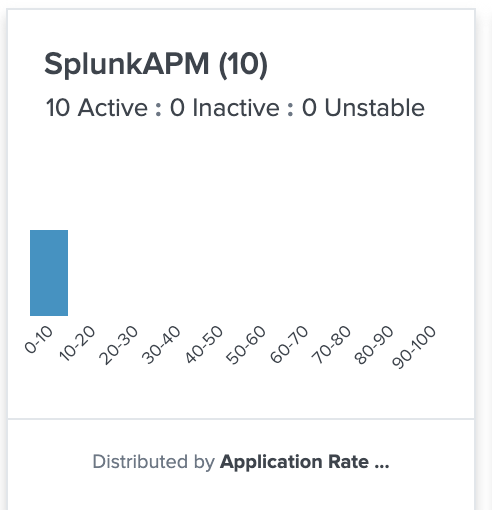
Note: there isn't any out of the box Key vital metrics so the visualisation will look like this
Task 4.5: Add a dashboard Navigation
Configuration -> Entity management -> Entity Types
Find SplunkAPM -> Edit
Open Navigations type
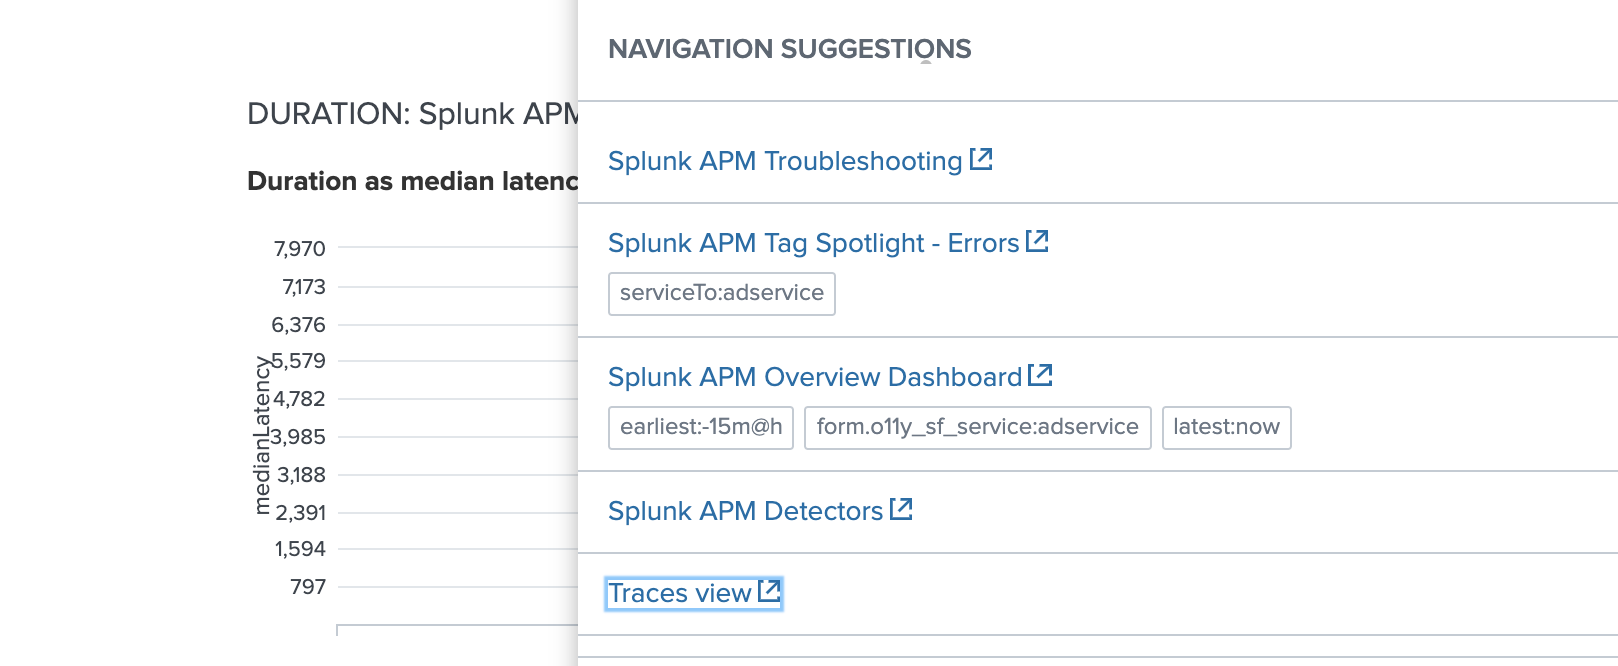
Navigation Name: Traces View
URL : https://app.${sf_realm}.signalfx.com/#/apm/traces
Save navigation !!
Save Entity type
In Service Analyzer open a Splunk APM entity and test your new navigation suggestion
Task 4.6: Add Key Vital metrics for Splunk APM.
Configuration -> Entity management -> Entity Types
Find SplunkAPM -> Edit
Open Vital Metrics
Enter a name
Add a metric
Enter the search below and click run search
| mstats avg(*) span=5m WHERE "index"="sim_metrics" AND sf_streamLabel="thruput_avg_rate" GROUPBY sf_service sf_environment | rename avg(service.request.count) as "val"
Entity matching field sf_service
(note: verify that you are matching entities 10 entities matched in last hour)
Unit of Display Percent (%)
Choose a Key Metric Select Application Rate Thruput
Save Application Rate
Save Entity Type
your UI should look like this should look like this